The rise of social media means we have massive amounts of data at our fingertips. What we do with all this information is up to us. Have you ever have logged on to face the only to discover the friend who has a post with one single data point and uses that as the basis of their argument? It’s perfectly acceptable to take a stance on a hot topic but you’ll come out looking foolish if you don’t understand the statistics and data points behind your argument. Don’t be that person.
My co-worker, Nick Landry, just shared this great post on exactly why statistics can be misleading as well. Worth a read.
In comes Naked Statistics
Growing up, I was never fond of mathematics. I struggled in high school with a solid 65 average (that is borderline failing in the United States), and a long believed that now just wasn’t for me. It was until recently ago that I discovered I really do love numbers and specifically statistics. It’s around this all the time whether through social media or my favorite thing, gaming. Looking back, I think educators were not ever explaining to me in a way that grabbed my attention that made me want to further my math education. The blame can’t lie solely on the educators I grew up with, so I recently took it into my own hands to further my own understanding of math.
I stumbled across the audio book Naked Statistics by Charles Wheelan, a professor at Dartmouth college. I found the narration to the enticing and upon finishing the audio book actually bought the physical copy and marked it up heavily with notes of my own.
Throughout the book the author gives great detail about how statistics can truly improve our lives while the same time helping readers understand the power that comes with it and how the power can be used and negative ways as well.
Now there are a few key points I want to highlight about the book:
- Statistics rarely offer a single “right” way of doing anything
- Statistics can be powerful for establishing an argument
However
- Statistics can also be very easy to misuse
The book opens with an explanation of the classic Monty Hall problem, which is a brain teaser in the form of a probability puzzle loosely based on the 1980’s television show “Let’s Make a Deal”. I’d never quite comprehend it the full detail of this problem until this book. I encourage you to look into unknown because not only to find to be interesting but also provided a great starting point for understanding for help powerful statistics can truly be.
Uses of Statistics
- Description and comparison
- Inference
- Assessing risk and probability
- Identifying important relationships (correlation)
Descriptive Statistics
“Who was the best baseball player of all time?”
Descriptive statistics can be technically accurate yet pretty misleading. The author explains that “The good news is that these descriptive statistics gives us a manageable and meaningful summary of the underlying phenomenon,” and continues with “the bad news is that any simplification invites abuse.”
Wheelan highlights the Gini Index, which is a measure of statistical dispersion intended to represent the income distribution of the nation’s residents and most commonly used to measure inequality. The problem however is that this is a mere useless stat. It simply takes the per capita income of a nation and divides it by the number of people. But who was actually earning how much of that income? That is the key missing piece.
Precision vs Accuracy
The author goes on to describe the differences between precision and accuracy.
Precision: “The exactitude with which we can express something”
Accuracy: “Measure of whether a figure is broadly consistent with the truth”
Correlation
“Measures the degree to which two phenomena are related to one another.
Correlation coefficient: Expressed on a scale of -1 -> 1
1: every change in one variable is associated with an equivalent change in the other variable in the same direction
-1: every change in one variable is associated with an equivalent change in the other variable in the opposite direction
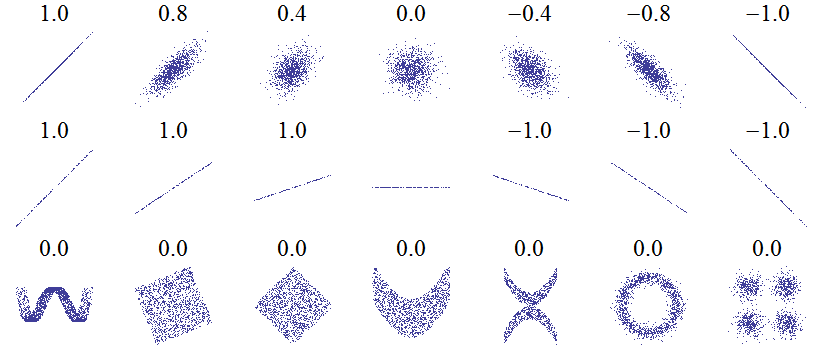
Source: Wikipedia
Probability:
“Study of events in outcomes including elements of uncertainty.”
There were a few key takeaways from this chapter:
- Don’t play Lotto (Pg. 80)
- You should invest in the stock market if you have a long-term investment horizon (because stocks typically have the best long-term returns)
- Probability is not deterministic
There are several problems with probability, however. The 2008 Wall Street crash and financial crisis largely had to do with computers misusing probability. The VaR model, or Value at Risk, which was called “potentially catastrophic”. Value at risk is a measure of risk in investments, and estimates how much a set of investments might lose given normal market conditions and a set time period, such as any day. This model offered 99% reassurance about 1% is the difference between success and failure.
The importance of data (Garbage in and out)
When working with numbers you assume that you retrieve and good data, but no amount of fancy analysis can make up for fundamentally flawed data.
Selection bias: “How have you chosen the samples you are evaluating?”
Self-selection bias: “Will arise whenever individuals volunteer to be any treatment group.”
Publication bias: “positive findings are more likely to be published”
This distorts the research that we see, or more evidently, do not see. This pious comes from not directly his studies themselves but from the skewed information that reaches the public. Typically, medical journals now require that any study be registered at the beginning of the project to help combat this problem of only publishing information that researchers want to see.
Inference
“The process by which data speaks to us enabling us to draw meaningful conclusions.” The typical tool that researchers will use is a hypothesis, which is a proposed explanation made on the basis of limited evidence as a starting point for further investigation.
While statistical inference offers many benefits it also comes with some significant pitfalls. Notably, statistical inference is based on a probability, And not some sort of absolute certainty.
Polling
The power polling comes also comes from the central limit theorem, similar to other forms of sampling. Where it differs however, is that we don’t care about the mean, but we actually care about the percentage, or proportion relative to our results. But again, this can be powerful for example the poll of 1000 individuals can offer meaningful insight into the attitudes of an entire nation.
Regression Analysis
“Allows us to quantify the relationship between a particular variable and how come we care about, while controlling for other factors.” It’s important to note there are many pitfalls of regression analysis, and is the hydrogen bomb of the statistical arsenal! Most of the studies that you read about in the newspaper are based on regression analysis.
Bringing it all together
Now that you’re more informed, consider these aspects of statistics the next time you stumble across an infographic on social media which illustrates only one point, or discover an article which takes a stand on a topic. I never realized how large of a role statistics plays in my life, but the author’s enthusiasm and clear instruction helped me to not only appreciate it, but has also further sparked my interest.
If you have other books you’d like to recommend regarding math, business, or computer science, I’d love to hear about them.
Key Takeaways:
- Statistics rarely offer a single “right” way of doing anything
- Statistics can be powerful for establishing an argument
However
- Statistics can also be very easy to misuse
-----------------------
@DaveVoyles